切换模式
返回顶部
首页
首页
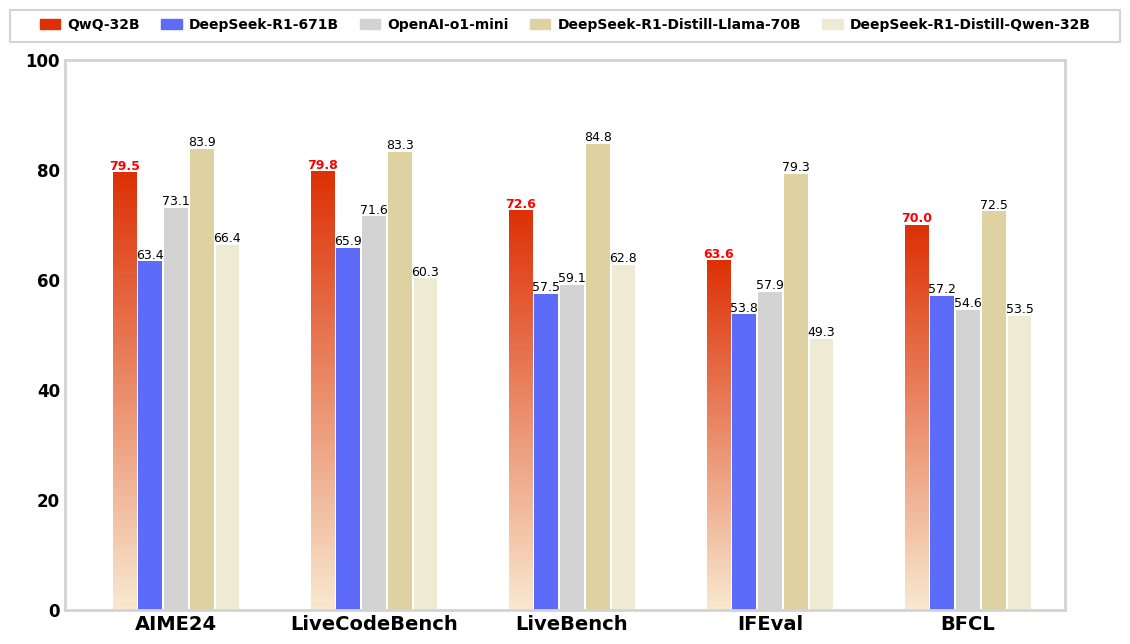
Python代码:多指标柱状图1
默认分类
·
04-02
ly
 ``` import matplotlib.pyplot as plt import numpy as np from matplotlib.patches import Rectangle from matplotlib.ticker import FixedLocator, FixedFormatter # 数据 models = ['QwQ-32B', 'DeepSeek-R1-671B', 'OpenAI-o1-mini', 'DeepSeek-R1-Distill-Llama-70B', 'DeepSeek-R1-Distill-Qwen-32B'] benchmarks = ['AIME24', 'LiveCodeBench', 'LiveBench', 'IFEval', 'BFCL'] data = [ [79.5, 79.8, 72.6, 63.6, 70.0], [63.4, 65.9, 57.5, 53.8, 57.2], [73.1, 71.6, 59.1, 57.9, 54.6], [83.9, 83.3, 84.8, 79.3, 72.5], [66.4, 60.3, 62.8, 49.3, 53.5] ] # 颜色值 colors = ['#dd3005', '#5c6bf8', '#d3d3d3', '#ded1a2', '#efead3'] # 创建图表 fig, ax = plt.subplots(figsize=(12, 8)) # 设置图表尺寸为 12 英寸宽、8 英寸高 # ==================== 可调节参数 ==================== legend_y_offset = 1.15 # 控制图例垂直位置(越大距离柱状图越远) legend_shift = -0.05 # 控制图例和矩形框整体下移的距离(负值表示下移) rect_padding = 0.02 # 矩形框内边距 rect_linewidth = 1.5 # 矩形框线宽 rect_color = '#d3d3d3' # 矩形框颜色(浅灰色) # 自定义空白长度(单位为英寸) top_margin_inch = 1.5 # 图表顶部留白 bottom_margin_inch = 1.0 # 图表底部留白 left_margin_inch = 1.0 # 图表左侧留白 right_margin_inch = 1.0 # 图表右侧留白 # 获取当前图表的总宽度和高度(单位为英寸) fig_width_inch, fig_height_inch = fig.get_size_inches() # 计算比例 top_margin_ratio = top_margin_inch / fig_height_inch bottom_margin_ratio = bottom_margin_inch / fig_height_inch left_margin_ratio = left_margin_inch / fig_width_inch right_margin_ratio = right_margin_inch / fig_width_inch # 自定义 y 轴范围 y_min = 0 # y 轴最小值 y_max = 100 # y 轴最大值 # ================================================== width = 0.12 gap_within_group = 0.01 gap_between_groups = 0.15 x = range(len(benchmarks)) offset = 0.15 # 计算 x 轴范围 left_edge = -offset right_edge = len(benchmarks) - 1 + 2 * offset + gap_between_groups * (len(benchmarks) - 1) ax.set_xlim(left_edge, right_edge) # 定义渐变色函数 def gradient_color(height, color_top="#dd3005", color_bottom="#f8e9d0"): gradient = np.linspace(0, 1, 256).reshape(-1, 1) gradient = np.hstack((gradient, gradient)) cmap = plt.cm.colors.LinearSegmentedColormap.from_list("gradient", [color_bottom, color_top]) return cmap(gradient) # 绘制柱状图 for i in range(len(models)): positions = [xi + offset + (width + gap_within_group) * i for xi in x] if i == 0: for j, pos in enumerate(positions): height = data[i][j] ax.imshow(gradient_color(height), extent=[pos - width / 2, pos + width / 2, 0, height], aspect="auto", origin="lower") else: ax.bar(positions, data[i], width, color=colors[i]) for j, pos in enumerate(positions): height = data[i][j] ax.text(pos, height, '%.1f' % data[i][j], ha='center', va='bottom', fontsize=9, color='red' if i == 0 else 'black', fontweight='bold' if i == 0 else 'normal') # 设置轴标签和样式 ax.set_xticks([p + offset + (width + gap_within_group) * (len(models) - 1) / 2 for p in x]) ax.set_xticklabels(benchmarks, fontsize=14, fontweight='bold') # ax.set_ylabel('Scores', fontsize=14, fontweight='bold') # 设置 y 轴范围 ax.set_ylim(y_min, y_max) # 设置 y 轴数字加粗 y_ticks = ax.get_yticks() # 获取当前 y 轴刻度值 y_tick_labels = [f'{int(tick)}' for tick in y_ticks] # 格式化刻度标签 # 使用 FixedLocator 和 FixedFormatter ax.yaxis.set_major_locator(FixedLocator(y_ticks)) # 设置刻度位置 ax.yaxis.set_major_formatter(FixedFormatter(y_tick_labels)) # 设置刻度标签 for label in ax.get_yticklabels(): label.set_fontsize(12) # 设置字体大小 label.set_fontweight('bold') # 设置字体加粗 for spine in ax.spines.values(): spine.set_color('#d3d3d3') spine.set_linewidth(2.0) ax.tick_params(axis='both', which='both', length=0) # 创建图例并设置文本加粗 legend_elements = [Rectangle((0, 0), 1, 1, color=c, label=m) for m, c in zip(models, colors)] legend = ax.legend(handles=legend_elements, loc='upper center', bbox_to_anchor=(0.5, legend_y_offset + legend_shift), # 放置在柱状图上方 ncol=len(models), fontsize=10, prop={'weight': 'bold'}, # 设置图例文本加粗 frameon=False, columnspacing=1.5, # 增大列间距以均匀分布 handletextpad=0.5, # 图例标记与文本之间的间距 handlelength=1.5) # 图例标记长度 # 获取图例的边界框 fig.canvas.draw() legend_bbox = legend.get_tightbbox(fig.canvas.get_renderer()) legend_bbox = legend_bbox.transformed(fig.transFigure.inverted()) # 动态计算矩形框的宽度和高度 rect_x = 0.5 - (legend_bbox.width / 2 + rect_padding) # 水平居中 rect_width = legend_bbox.width + 2 * rect_padding # 矩形框宽度 rect_y = legend_bbox.ymin - legend_bbox.height-2.5*rect_padding # 垂直居中 rect_height = 2 * rect_padding # 矩形框高度 # 绘制矩形框 rect = Rectangle((rect_x, rect_y), rect_width, rect_height, transform=fig.transFigure, edgecolor=rect_color, # 浅灰色 facecolor='none', linewidth=rect_linewidth, # 加粗 clip_on=False) fig.patches.append(rect) # 自定义左右上下留白距离 plt.subplots_adjust( top=1 - top_margin_ratio, # 上方留白 bottom=bottom_margin_ratio, # 下方留白 left=left_margin_ratio, # 左侧留白 right=1 - right_margin_ratio # 右侧留白 ) # 保存为 1200x800 像素的 PNG 图片 plt.savefig('1.png', dpi=100, bbox_inches='tight') # 设置 dpi=100,确保分辨率为 1200x800 # 如果需要展示图表,可以保留下面这行代码(存在bug---show和savefig生成图片不一致,我这里确保savefig是对的) # plt.show() ```
取消回复
提交评论
ly
热门文章
最新评论
鍗庣撼鍏徃鍚堜綔寮€鎴锋墍闇€鏉愭枡锛熺數璇濆彿鐮?5587291507 寰俊STS5099: 华纳东方明珠客服电话是多少?(??155--8729--1507...
鍗庣撼鍏徃鍚堜綔寮€鎴锋墍闇€鏉愭枡锛熺數璇濆彿鐮?5587291507 寰俊STS5099: 华纳东方明珠客服电话是多少?(??155--8729--1507...
鍗庣撼鍏徃鍚堜綔寮€鎴锋墍闇€鏉愭枡锛熺數璇濆彿鐮?5587291507 寰俊STS5099: 华纳东方明珠客服电话是多少?(??155--8729--1507...
鍗庣撼鍏徃鍚堜綔寮€鎴锋墍闇€鏉愭枡锛熺數璇濆彿鐮?5587291507 寰俊STS5099: 华纳东方明珠客服电话是多少?(??155--8729--1507...
鍗庣撼鍏徃鍚堜綔寮€鎴锋墍闇€鏉愭枡锛熺數璇濆彿鐮?5587291507 寰俊STS5099: 华纳东方明珠客服电话是多少?(▲18288362750?《?微信...
鍗庣撼鍏徃鍚堜綔寮€鎴锋墍闇€鏉愭枡锛熺數璇濆彿鐮?5587291507 寰俊STS5099: 华纳东方明珠客服电话是多少?(▲18288362750?《?微信...
鍗庣撼鍏徃鍚堜綔寮€鎴锋墍闇€鏉愭枡锛熺數璇濆彿鐮?5587291507 寰俊STS5099: 华纳东方明珠客服电话是多少?(▲18288362750?《?微信...
热门标签
关于站长
Theme
Jasmine
by
Kent Liao